

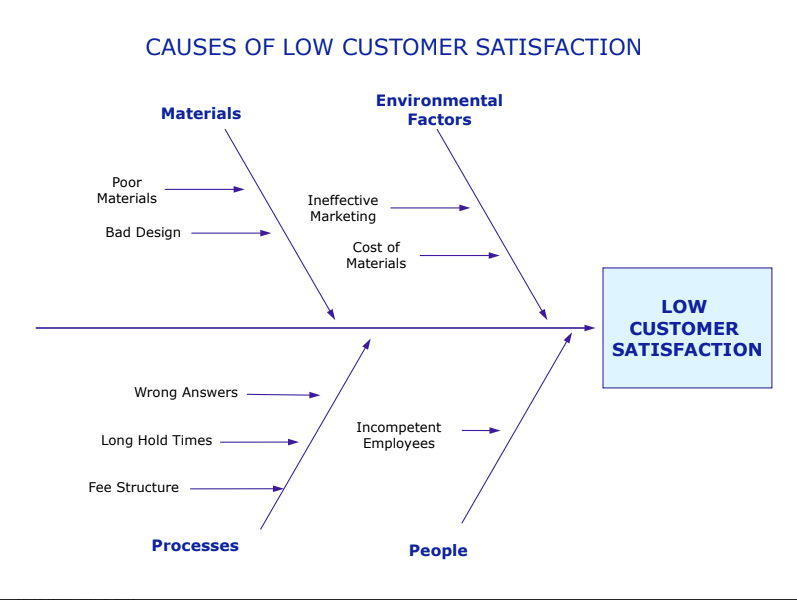
In any improvement project, a fishbone diagram helps identify the possible causes and effects of a problem that could impact the outcome. Typically, the diagram is organized into categories like people, processes, policies, materials, and environmental factors.
Table of Contents
Assignments
Create a fishbone diagram for the problem you’ve identified in your DNP project. This diagram will help you develop your problem statement, so it’s a good idea to complete this before working on the statement itself. Use the template provided in the Resources section below. If you find that a category doesn’t apply to your problem, that’s fine, but make sure to provide enough detail to show that you’ve considered different aspects of the issue and have a clear understanding of it. Be sure to upload the diagram by the due date to get feedback from your advisor.
Rubric
Fishbone Diagram
| Criteria | Ratings | |
| Problem identified Clearly identifies problem of interest | 10 pts Full Marks | 0 pts No Marks |
| Utilizes each header category as appropriate to the problem Provides multiple contributing causes in each header category as appropriate for the problem identified. If a header is not applicable to the problem it does not need to be used. | 5 pts Full Marks | 0 pts No Marks |
| Examples provided under each heading which may impact problem Provides several examples under each heading with sufficient detail to understand how it may contribute to the problem. | 10 pts Full Marks | 0 pts No Marks |
| Scholarly writing Clear, concise, grammatically correct, no misspelled words or abbreviations used. | 5 pts Full Marks | 0 pts No Marks |
| Organizational Assessment Description of the organization including predominant leadership style. Describes the approval process for projects in the organization. | 10 pts Full Marks | 0 pts No Marks |
| Late submission Minus 5 points per each day late in submitting Total Point: 30 | 0 pts Full Marks | 0 pts No Marks |
Resources
Use this template for your fishbone diagram.Download template for your fishbone diagram.
Here’s an example of a completed Download example of a completed fishbone diagram related to low customer satisfaction. Here’s another example related to delays in test results Download delays in test results.
Fishbone diagrams are used for non-healthcare-related issues, as seen in this example for missed free throws Download example for missed free throws.
Tenerife Air Disaster
The Tenerife Air Disaster has been used to demonstrate the use of fishbone or cause and effect diagrams. You are encouraged to view the video below and as you watch and listen consider the following questions:
- What went wrong?
- How did each factor converge to contribute to the final outcome?
- How does the fishbone diagram or root cause analysis apply to the Tenerife disaster?
The video on the Tenerife Air DisasterLinks to an external site.. A detailed fishbone diagram is provided Download detailed fishbone diagram is provided which has been used in a variety of situations to understand the benefits of this tool in analyzing quality improvement events.
Fishbone Diagram Example
Must Read: